7 Things to do with a Meertrack Export
Concrete moves teams run with a competitor data export: live battlecards, Friday CRO updates, board slides, BigQuery joins, Claude Projects, archives.

Contents
- 1. Drop it into your battlecard doc
- 2. Send a Friday CRO update built from a filtered export
- 3. Line up 90 days of competitor hiring in a sheet
- 4. Build a board-meeting slide on competitor velocity
- 5. Pipe the JSON export into BigQuery for trend analysis
- 6. Prime an internal Claude Project with the JSON
- 7. Archive every quarter for retros and asks-and-answers
- What we won't do
Concrete moves teams run after pulling a CSV or JSON from Meertrack: battlecards, Friday CRO emails, board slides, BigQuery joins, Claude Projects, and quarterly archives.
The hardest part of competitive intelligence is getting the tracked data into the docs, decks, and pipelines the rest of your company already reads. A platform that holds your competitor activity hostage in its own dashboard loses to whoever's running spreadsheets. Meertrack's export is how the data gets out: on every plan, CSV or JSON, filterable by competitor, data type, and date range. Everything below is about making that happen.
1. Drop it into your battlecard doc
Filter the export to one competitor, data type "Pricing", last 90 days, and paste the rows into your existing battlecard's pricing tab. Sort by date.
Most battlecards lose to time. The "competitor pricing" tab gets written once during a sales kickoff and drifts for six months until someone notices the prices on the page don't match the prices in the doc. By then reps have already been quoting last quarter's pricing on calls. Re-pasting the export keeps dated evidence under every claim instead of a Q2 snapshot.
The same move works for messaging changes (paste into the "positioning" tab), case studies (paste into the "social proof" tab), and new pages (paste into "what's shipping"). A battlecard built like this stops being a static document and starts being a log.
We run this loop on our own battlecards. Re-pasting the last week's pricing rows for the competitors we track takes about three minutes each, and the battlecard ends up where reps actually read it instead of buried in a dashboard tab.
2. Send a Friday CRO update built from a filtered export
Friday morning, you owe leadership a competitive update. Most of these emails get written from memory on Thursday night, which is why they're vague, miss things, and look the same as the last one. The shortcut: filter the export to the last 7 days, the competitors leadership cares about, all data types. Paste the rows into the email and add one line of commentary per item.
The export already has the format leadership wants: dated, sourced, scannable. The writing job shrinks to one line of context per row. A typical output: a subject line, six rows with dates and source URLs, one line of context per row. Think: a pricing change on a competitor's Team tier, a product launch, two new VP of Sales listings. Twenty minutes for something that used to be an hour of "what did I miss this week?"
3. Line up 90 days of competitor hiring in a sheet
Filter to data type "Job Listings", last 90 days, the competitors you care about. In Sheets, run a pivot table with rows = team / department, columns = month, values = count of listings.
Hiring is a leading indicator. We wrote about this in How to read competitor job postings as a 6-18 month leading indicator. The export is the fastest way to act on it.
The pivot table tells you where a competitor is investing before they announce it. Three engineering hires in payments in one month is a payments team being staffed up. A cluster of GTM listings in EMEA usually means a region launch you'll see press coverage for in six weeks, sometimes paired with a couple of senior PM hires that point at a product re-org behind it.
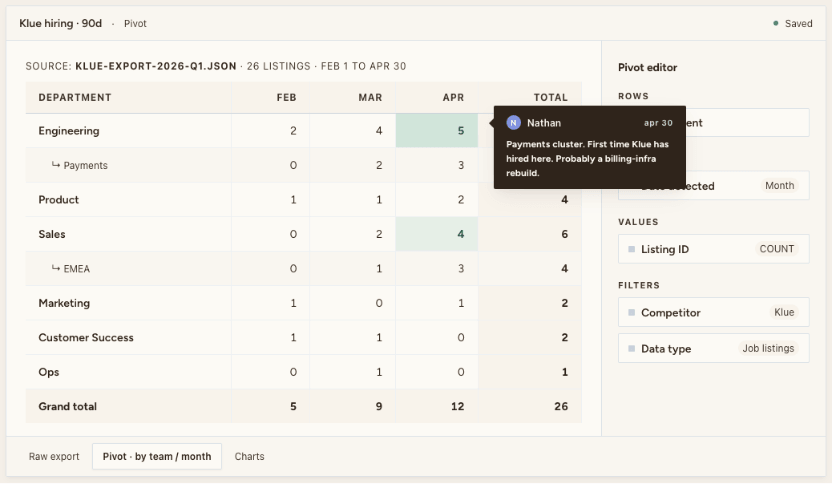
What you're reading is the count moving over time, not any individual listing.
4. Build a board-meeting slide on competitor velocity
Pull a one-quarter export across every tracked competitor, count rows per data type per competitor, and build a stacked bar chart with one competitor per bar (blog posts in one color, press in another, pricing in another, hiring in another). Title it "competitive activity, last 90 days."
"Our competitors are moving fast" is the weakest claim in any board deck, and the most common.
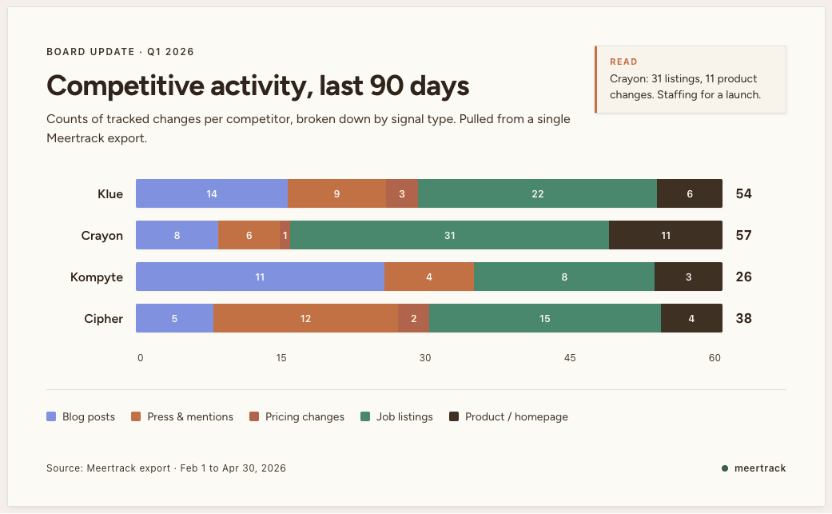
Three minutes of work in Sheets or Numbers. The slide does what "competitors are moving fast" can't: it shows velocity broken down by signal type. When one competitor is ahead on hiring and another is ahead on press, you already know whose roadmap to watch versus whose messaging to counter.
If your board meeting is monthly, the same slide gets re-built in three minutes from the latest export. Four quarters in, the trend line tells the board something the snapshot can't.
5. Pipe the JSON export into BigQuery for trend analysis
Drop the JSON export into BigQuery (or Snowflake, Postgres, or DuckDB on a laptop) and competitor activity becomes a queryable table alongside whatever else lives in your warehouse. The JSON keeps the structure intact: each tracked change is an object with typed fields (competitor, data type, date detected, source URL, captured content, our AI classification). CSV is for spreadsheets; JSON is for warehouses.
"Our competitors are moving fast" is hard to act on. "Our win rate moved in the 30 days after their price increase" is not. Without the join, the first question stays rhetorical, answered by whoever speaks first in the debrief.
Worked example. Join the pricing-change rows from the export with closed-won deal data from your CRM, on a 30-day window after each change. Now you can see whether your win rate against that competitor moved when they raised their price. If it moved, you have a decision to make about pricing. If it didn't, that's also information. Their pricing changes may not be the lever you thought. Competitive intelligence platforms don't answer that question for you because they don't have your CRM data. The export sidesteps the problem by handing you raw rows you can join against anything. That answer only exists because the data left the CI tool.
6. Prime an internal Claude Project with the JSON
Most people use LLMs for CI by pasting a competitor's homepage and asking for a summary. That's a static answer from a static page. Drop the JSON file into a Claude Project instead and ask the model questions grounded in real tracked text. A JSON export of a competitor's last 90 days is one file holding every tracked change as a structured record: the captured text, the source URL, the date detected, our classification. Usually a few dozen records per competitor per quarter, small enough that the model can read the whole file in one go.
Set the project description to "this is a corpus of every change Meertrack tracked from [competitor] in the last 90 days," then try prompts like "what's the strongest thread in their messaging this quarter?" or "what's repeated across job descriptions and case studies?" or "draft the three sentences I'd open a sales call with against this competitor today."
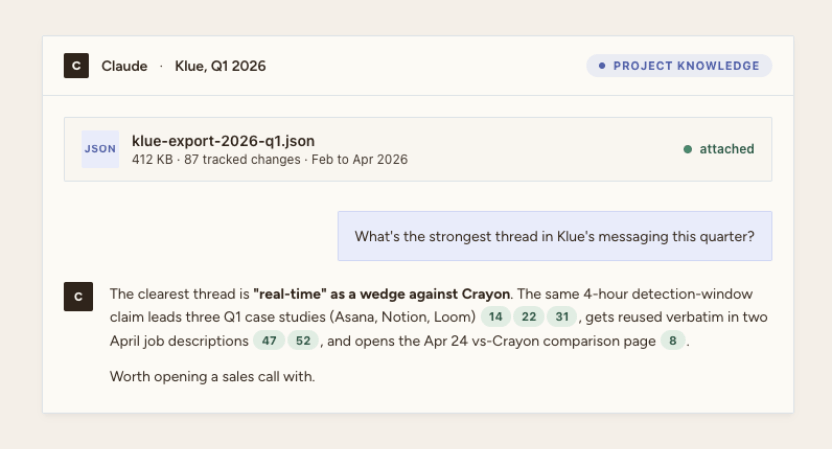
The model answers from the file instead of hallucinating. Every re-export adds to the log, and the answers get sharper as the record grows. The kind of answer it returns: a thread that shows up in three case studies leading with the same ROI claim, plus two job descriptions reusing the same phrase. That's worth opening a sales conversation with.
7. Archive every quarter for retros and asks-and-answers
At the end of every quarter, pull a full export per tracked competitor and drop the files in a folder named after the quarter. Done.
The archive isn't impressive in the moment. It pays off six months later when someone on Slack asks "did they always charge $99?" or "when did they pivot the homepage to the AI angle?" or "weren't they hiring sales before the layoffs?" The archive answers in 30 seconds with a date and a source URL. Without it, the answer is "I think so?" and the conversation moves on without resolution.
The same archive turns the quarterly retro from a vibes session into a sourced one. "Here's what shipped. Here's what they shipped. Here's what we got right and what we missed." With dates.
What we won't do
CI data is yours. We're not going to put a paywall between you and your own export six months from now. No historical-data tier, and we won't gate filters by plan. The export is on every Meertrack account today and stays there.
Pick one or two of the moves above and run them. The whole point of the export is that the data ends up somewhere your team actually opens.